The Influence of the Economy on Elections
The economy has long been thought a fundamental predictor of election outcomes. The basic premise is: when the economy is doing well, incumbent vote share is higher and vice-versa. In the book Democracy for Realists, Larry Bartels and Christopher Achen describe this theory at length and the predictive power of economic conditions in the months leading up the election. My second blog post explores the predictive power of economic conditions on incumbent party vote share, especially quarter 2 (Q2) GDP growth.
The graph below maps the historical relationship between Q2 GDP growth and national incumbent two-party vote share. The graph includes two historic trend lines, one from 1948-2020 and one excluding 2020. 2020 was an incredibly unique election, taking place during the COVID-19 pandemic, which resulted in very unique economic conditions. It is a visible outlier in the data.
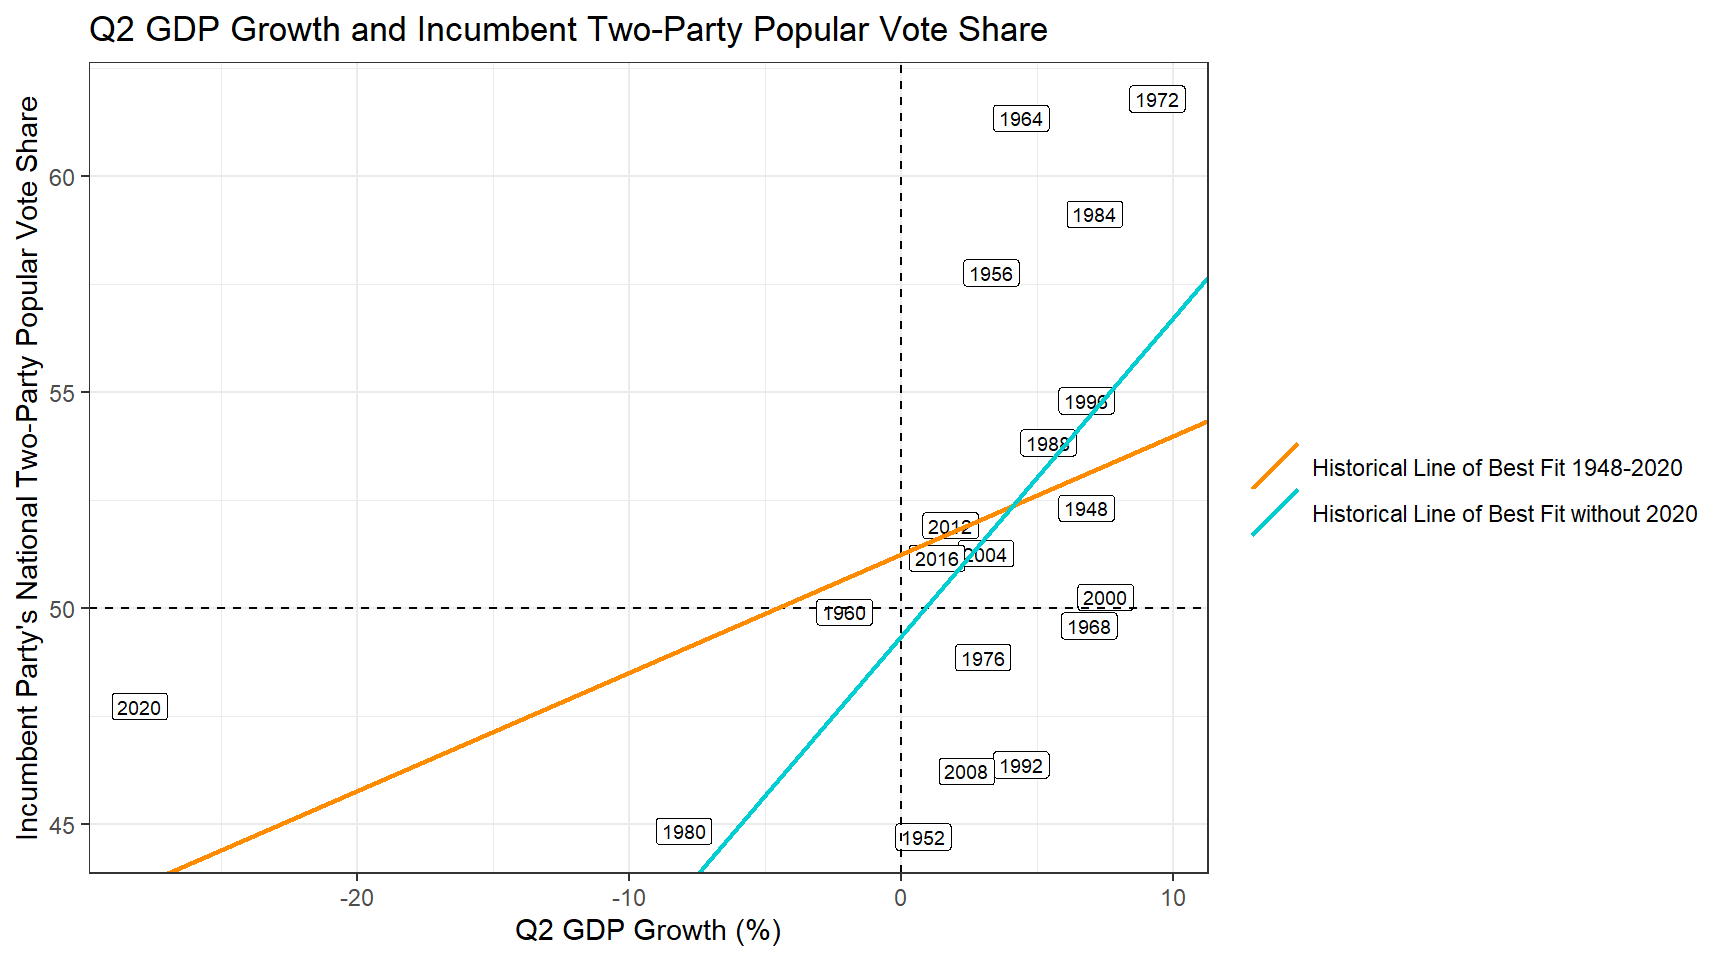
We can see that the historic trend lines differ heavily depending on whether 2020 is included or not. When 2020 is included, the slope of the line (and the impact of Q2 GDP growth on the popular vote) is diluted.
Let’s take a look at the linear regression results:
| Q2 GDP Model | Coefficient | P-Value |
|---|---|---|
| (Intercept) | 51.26 | 0.00 |
| GDP_growth_quarterly | 0.27 | 0.06 |
| Q2 GDP Model, Excluding 2020 | Coefficient | P-Value |
|---|---|---|
| (Intercept) | 49.38 | 0.00 |
| GDP_growth_quarterly | 0.74 | 0.01 |
The adjusted r squared for the models are 0.140 for the model including 2020 and 0.283 for the model excluding 2020.
Comparing the two models using only Q2 GDP growth, the model including 2020 finds a relationship between Q2 GDP growth and incumbent two party vote share with 0.06 significance level (p-value) and an adjusted R squared value of 0.14, meaning that 14% of the variance can be explained by Q2 GDP growth. Excluding 2020, the coefficient can be found significant at the 0.01 p-value and the model explains 28.3% of the variance. Based on these results, I choose to explore the rest of my models excluding the year 2020.
We can interpret the 2020 exclusion model to show that for each percentage change in Q2 GDP growth, the popular vote for the incumbent party would grow by 0.74 percentage points.
The 21st Century
Though the above prediction model works somewhat well and is rooted heavily in social science research, I do want to take a moment to highlight a trend I saw while visually examining the economic correlations in class. The trends we see historically might not necessarily hold the same weight in the 21st century.
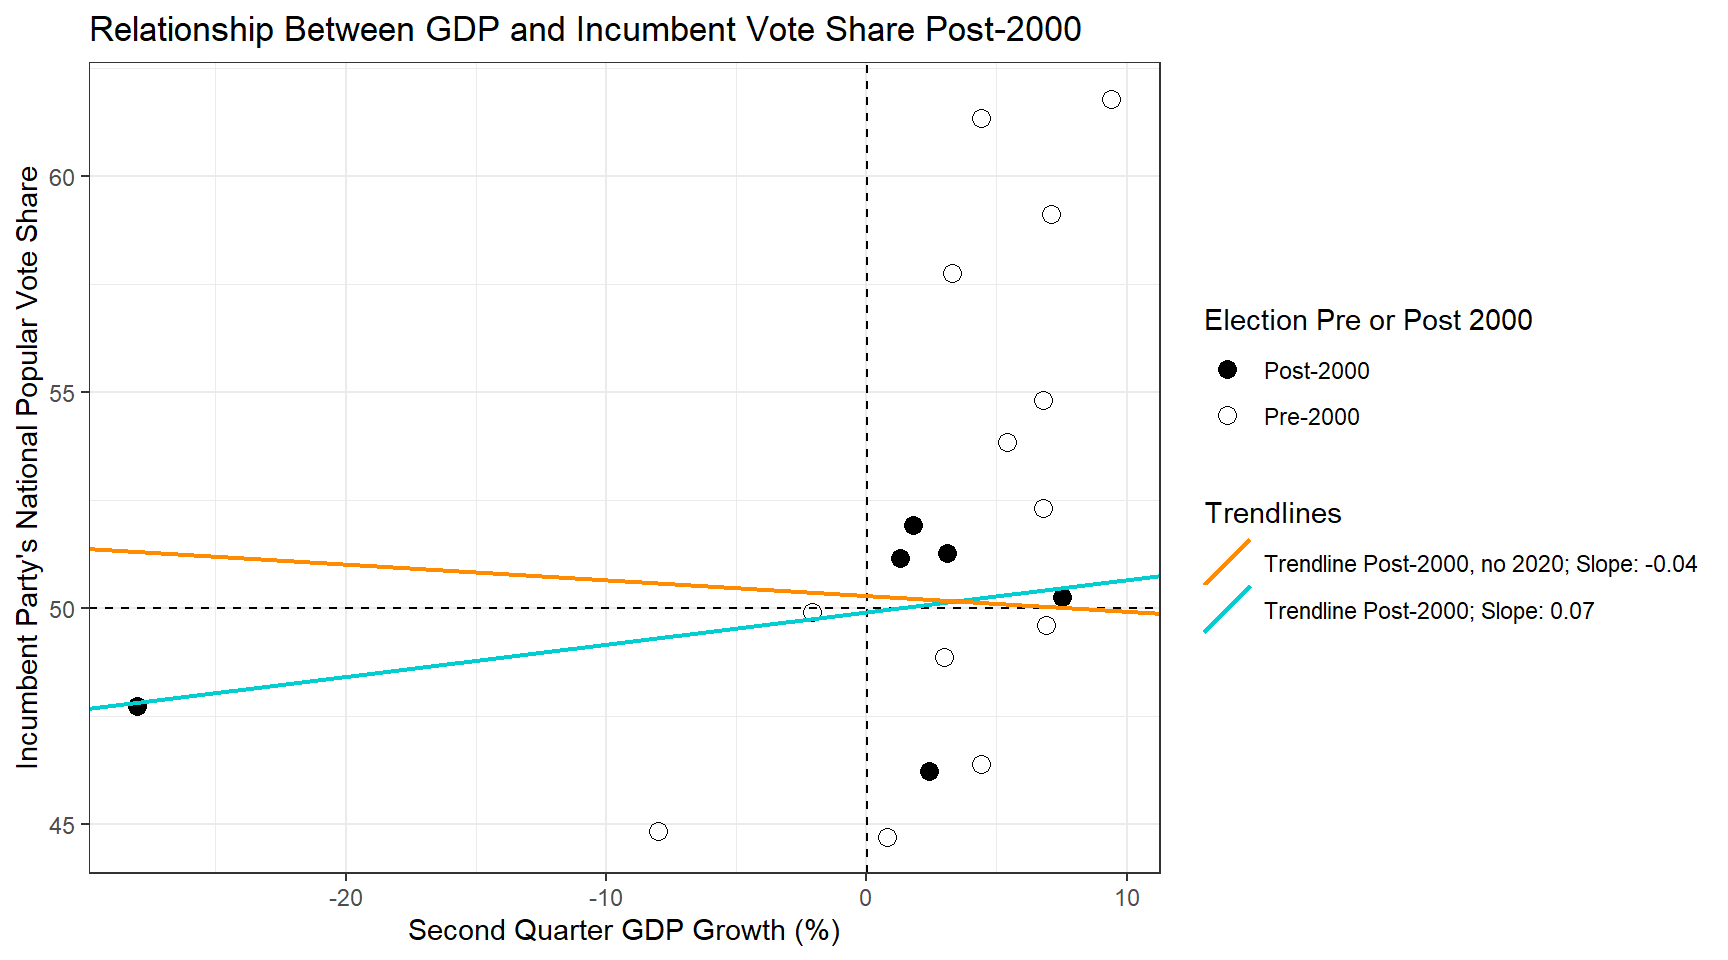
If we look at only elections that have occurred in the 21st century, the relationship between GDP growth and incumbent vote share is inconclusive. The two lines of fit represent only elections post-2000, one with and one without the previously identified outlier of 2020. With or without 2020, a one percentage point change in GDP growth results in much smaller impacts on incumbent vote share than the broader historical models examines above.
Interpreting these results, for the 2000-2020 model we see that a one percentage point increase in Q2 GDP growth corresponds to a 0.07 percentage point increase in incumbent vote share. In the model excluding 2020, a one percentage point increase in Q2 GDP growth actually would result in a 0.04 percentage point decrease in incumbent vote share.
There are some serious issues with training a model on six (five) data points, including model over-fitting, but I did want to draw attention visually to this trend in the data. I hypothesize that, as partisanship has become an exceedingly salient pillar of American society, the average voter may be voting along party lines more than in their own economic self-interest. I look forward to exploring that hypothesis further as I progress through this class.
The Choice Not to Add More Predictive Variables
One method we could consider to improve our economic model of vote share is to add more economic predictive variables to get a better picture of the economy. However, if different economic variables are highly correlated with one another, we may run into issues of co-linearity which interferes with model performance. I tested several possible predictive economic variables for co-linearity and found that annual GDP is strongly correlated with RDPI and adjusted closing stock prices, so those measures will be excluded. On the other hand, Q2 GDP growth and Q2 RDPI growth are very uncorrelated, as are annual GDP and unemployment and Q2 GDP growth and annual GDP.
Checking the correlations between incumbent vote share and Q2 RDPI, unemployment and annual GDP, I found that all correlations are weak and negative. Because of this, I decided to keep my model simple and prioritize not over-fitting by using only Q2 GDP growth.
Economic Influence at the State Level
One could hypothesize that perhaps local economic factors could influence the incumbent two party vote share within a given state. Here, I explore that idea by using Federal Reserve Economic Data from the St. Louis Federal Reserve Bank on state level unemployment.
Below are summaries of two models, one using only state unemployment to predict incumbent vote share and the other using both state unemployment and national Q2 GDP growth.
| State Only Model | Coefficient | P-Value |
|---|---|---|
| (Intercept) | 48.93 | 0.00 |
| avg_unemployment | 0.21 | 0.48 |
| stateAlaska | 0.57 | 0.90 |
| stateArizona | 1.62 | 0.73 |
| stateArkansas | -1.32 | 0.78 |
| stateCalifornia | 1.09 | 0.81 |
| stateColorado | 0.46 | 0.92 |
| stateConnecticut | 2.22 | 0.63 |
| stateDelaware | 1.87 | 0.69 |
| stateDistrict Of Columbia | 5.87 | 0.27 |
| stateFlorida | 1.62 | 0.73 |
| stateGeorgia | 0.57 | 0.90 |
| stateHawaii | 2.77 | 0.56 |
| stateIdaho | -0.02 | 1.00 |
| stateIllinois | 0.63 | 0.89 |
| stateIndiana | 0.12 | 0.98 |
| stateIowa | -1.01 | 0.83 |
| stateKansas | -0.35 | 0.94 |
| stateKentucky | -0.86 | 0.85 |
| stateLouisiana | 0.39 | 0.93 |
| stateMaine | 1.76 | 0.71 |
| stateMaryland | 1.73 | 0.71 |
| stateMassachusetts | 0.91 | 0.85 |
| stateMichigan | 0.56 | 0.90 |
| stateMinnesota | -0.62 | 0.90 |
| stateMississippi | 1.00 | 0.83 |
| stateMissouri | -0.97 | 0.83 |
| stateMontana | -1.86 | 0.69 |
| stateNebraska | 0.90 | 0.85 |
| stateNevada | 0.32 | 0.94 |
| stateNew Hampshire | 2.22 | 0.64 |
| stateNew Jersey | 2.71 | 0.56 |
| stateNew Mexico | 0.17 | 0.97 |
| stateNew York | 1.49 | 0.75 |
| stateNorth Carolina | 0.59 | 0.90 |
| stateNorth Dakota | -1.36 | 0.77 |
| stateOhio | 0.19 | 0.97 |
| stateOklahoma | 0.05 | 0.99 |
| stateOregon | -0.56 | 0.91 |
| statePennsylvania | -0.53 | 0.91 |
| stateRhode Island | 1.26 | 0.79 |
| stateSouth Carolina | 0.69 | 0.88 |
| stateSouth Dakota | -1.47 | 0.76 |
| stateTennessee | -0.48 | 0.92 |
| stateTexas | 0.27 | 0.95 |
| stateUtah | 1.04 | 0.83 |
| stateVermont | 2.43 | 0.61 |
| stateVirginia | 1.92 | 0.68 |
| stateWashington | 0.33 | 0.94 |
| stateWest Virginia | -3.20 | 0.49 |
| stateWisconsin | -0.17 | 0.97 |
| stateWyoming | -0.94 | 0.84 |
| State and National Model | Coefficient | P-Value |
|---|---|---|
| (Intercept) | 42.91 | 0.00 |
| avg_unemployment | 0.70 | 0.02 |
| GDP_growth_quarterly | 0.82 | 0.00 |
| stateAlaska | 0.16 | 0.97 |
| stateArizona | 1.96 | 0.66 |
| stateArkansas | -0.98 | 0.82 |
| stateCalifornia | 0.95 | 0.83 |
| stateColorado | 1.29 | 0.77 |
| stateConnecticut | 2.93 | 0.51 |
| stateDelaware | 2.62 | 0.56 |
| stateDistrict Of Columbia | 4.99 | 0.32 |
| stateFlorida | 2.04 | 0.65 |
| stateGeorgia | 1.00 | 0.82 |
| stateHawaii | 3.83 | 0.39 |
| stateIdaho | 0.54 | 0.90 |
| stateIllinois | 0.68 | 0.88 |
| stateIndiana | 0.59 | 0.89 |
| stateIowa | 0.20 | 0.96 |
| stateKansas | 0.83 | 0.85 |
| stateKentucky | -0.62 | 0.89 |
| stateLouisiana | 0.39 | 0.93 |
| stateMaine | 2.38 | 0.59 |
| stateMaryland | 2.57 | 0.56 |
| stateMassachusetts | 1.62 | 0.72 |
| stateMichigan | 0.10 | 0.98 |
| stateMinnesota | 0.41 | 0.93 |
| stateMississippi | 0.87 | 0.84 |
| stateMissouri | -0.42 | 0.92 |
| stateMontana | -1.23 | 0.78 |
| stateNebraska | 2.66 | 0.56 |
| stateNevada | 0.51 | 0.91 |
| stateNew Hampshire | 3.54 | 0.43 |
| stateNew Jersey | 2.99 | 0.50 |
| stateNew Mexico | 0.25 | 0.95 |
| stateNew York | 1.65 | 0.71 |
| stateNorth Carolina | 1.17 | 0.79 |
| stateNorth Dakota | 0.20 | 0.96 |
| stateOhio | 0.34 | 0.94 |
| stateOklahoma | 1.08 | 0.81 |
| stateOregon | -0.60 | 0.89 |
| statePennsylvania | -0.27 | 0.95 |
| stateRhode Island | 1.57 | 0.72 |
| stateSouth Carolina | 1.00 | 0.82 |
| stateSouth Dakota | 0.19 | 0.97 |
| stateTennessee | -0.08 | 0.99 |
| stateTexas | 0.81 | 0.86 |
| stateUtah | 2.17 | 0.63 |
| stateVermont | 3.55 | 0.43 |
| stateVirginia | 3.07 | 0.49 |
| stateWashington | 0.42 | 0.92 |
| stateWest Virginia | -3.76 | 0.40 |
| stateWisconsin | 0.70 | 0.87 |
| stateWyoming | 0.15 | 0.97 |
Adjusted R-squared values for each model are -0.081 for the state economic factor only model and 0.025 for the state and national economy prediction model.
Considering models that factor in state economic conditions, it’s clear that predictive economic variables still do not fit the data entirely well. A model based solely on state unemployment data, controlling for state, finds no statistically significant relationship between state level unemployment and incumbent party vote share, and actually has a negative adjusted R squared. On the other hand, a model that factors in both state level unemployment and national Q2 GDP growth, controlling for state, finds a statistically significant relationship between incumbent vote share and state unemployment (0.02 p-value) and Q2 GDP growth (approximately 0 p-value). That being said, the adjusted R squared value shows that these variables only account for about 2.5% of the variance in incumbent vote share and has low predictive power.
All things considered, none of the models examined here have high predictive power. If I had to predict the election based solely on the economic variables examined in this blog post, I would predict the national two-party popular vote based on national Q2 GDP growth. However, as this course goes on and I am given the opportunity to predict the election outcome on more than one predictive factor at once, I would be inclined to use the state-level model predicting on both national Q2 GDP growth and state unemployment.
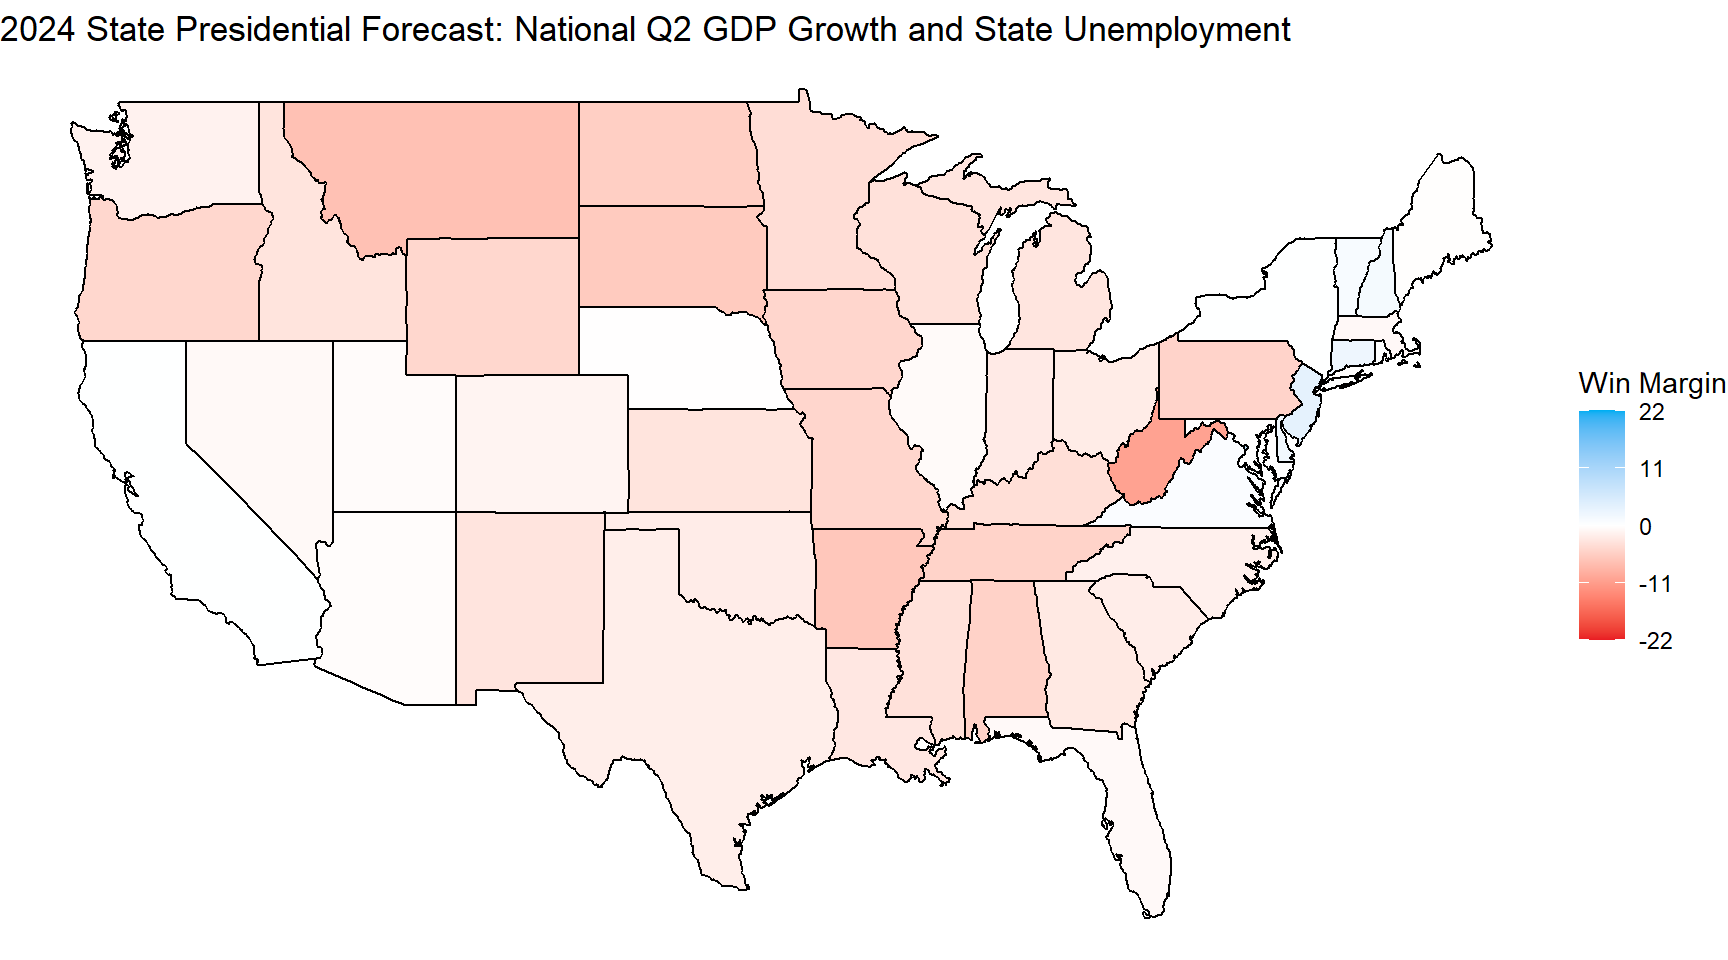
Predicting 2024
Using the model based solely on Q2 GDP growth, I would predict that Kamala Harris will beat Former President Trump in the two-party national popular vote 51.58% to 48.42%.
Using the incomplete state and national economy model, which I hope to use as a stepping stone towards later, more complex models, the election would be overwhelmingly in Former President Trump’s favor. I cannot stress enough that this model does not have anywhere near sufficient predictive power to predict the election without more variables, and is merely an incomplete model that I wanted to map out for later reference as I add more predictive variables later in the class.
| Candidate | Electoral College Votes |
|---|---|
| Harris | 137 |
| Trump | 401 |
Using this model, as it stands now, to predict the election, Trump would completely sweep the election, winning 401 electoral votes to Harris’ 137.
Conclusion
While the economy may be a fundamental predictor of election outcomes, it is far from the only one. Especially in recent elections, the economy may have less of an influence on the national two-party vote share. I’m excited to continue updating my predictions to be more complex and include more data as the semester goes on.